Q&A with Dan Carlson, Science Officer, Mission Arctic
The Mission Arctic team has returned safely home from their extreme adventure, gathering information about lost expedition sites, climate change, the wooly mammoth, hidden treasures, and more.
This week’s Mission Arctic crew member Q&A features Science Officer Dr. Dan Carlson and his experience at sea. Dr. Carlson chatted with us about his overall objectives for the trip, and the unique technologies he used—in addition to his Lenovo Think laptop—to collect intel and conduct research to share with his colleagues at the Arctic Research Center.
Q: What is Mission Arctic?
Dr. Dan Carlson: Mission Arctic is an unprecedented opportunity for the team to recover some instruments that have been sitting on the sea floor for about a year now—instruments that hold vital information about the arrival and duration of warm water that could melt the ice sheet from below. For this mission, the team travelled into a handful of fjords and collecting vertical profiles of temperature and salinity to document presence/absence of warm ocean water and to quantify the amount of freshwater from the glaciers. I mapped some coastal areas both for vegetation and archaeological findings for my colleagues back at the Arctic Research Center.
Q: How did you become involved with the expedition? What sparked your interest in becoming a crew member?
DC: Honesty, I got involved so long ago that I don’t remember how exactly it started. Regardless, we’d been planning and plotting for years and it was great to finally be out here together.
Q: What makes technology so important to the success of the expedition?
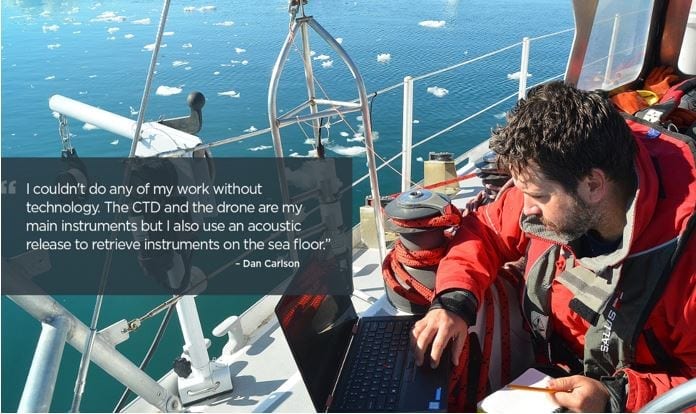
DC: Technology is of paramount importance to our success; I couldn’t do any of my work without technology. The CTD and the drone are my main instruments, in addition to an acoustic release to retrieve instruments on the sea floor. Each one has a unique acoustic code that, when received, alerts it to drop its anchor so it can float to the surface. Once I have the data, I analyze and visualize it with several programs. The ocean data is analyzed primarily in Matlab, while the imagery goes into PhotoScan to create 3D renderings and digital surface models.
Q: Can you share a bit about a typical day at sea?
DC: A typical day involved waking up, remembering where I was, then wriggling out of my tiny bunk without bumping my head or twisting my ankle. After that it was either sailing or profiling with the CTD. I downloaded and archived the data after every cast, as any cast could have been the last. Unfortunately, the office followed me to sea, so I had to respond to manuscript reviews that I submitted before I left, and prepare additional manuscripts and proposals.
Q: What will Mission Arctic do with the insights gained from this expedition?
DC: We will combine the data with data collected previously this year and analyze it to see if any patterns emerge.
Stay tuned for next week’s Q&As with glaciologist Dr. Ulyana Horodyskyj. Until then, stay updated with the Mission by following @LenovoPress, @MissionArctic and Mission Arctic’s website.
Tags
mission arctic; arctic research center; think pc; expedition